


IGCSE Mathematics (0580) Core: Topic Trend Analysis for Paper 1 & Paper 3
Cambridge IGCSE Mathematics (0580) Core candidates sit two papers — Paper 1 (non-calculator, short-answer) and Paper 3 (calculator-allowed, structured). While both draw on the same nine topic areas, the way marks and questions are distributed across them is strikingly different. This report analyses twelve years of past paper data (2013–2024) to show exactly where marks are concentrated in each paper, which topics carry more weight than their question count suggests, and how the balance has shifted in recent years — useful groundwork for planning revision priorities across both papers.
Paper 1 (Core): Topic Distribution Overview
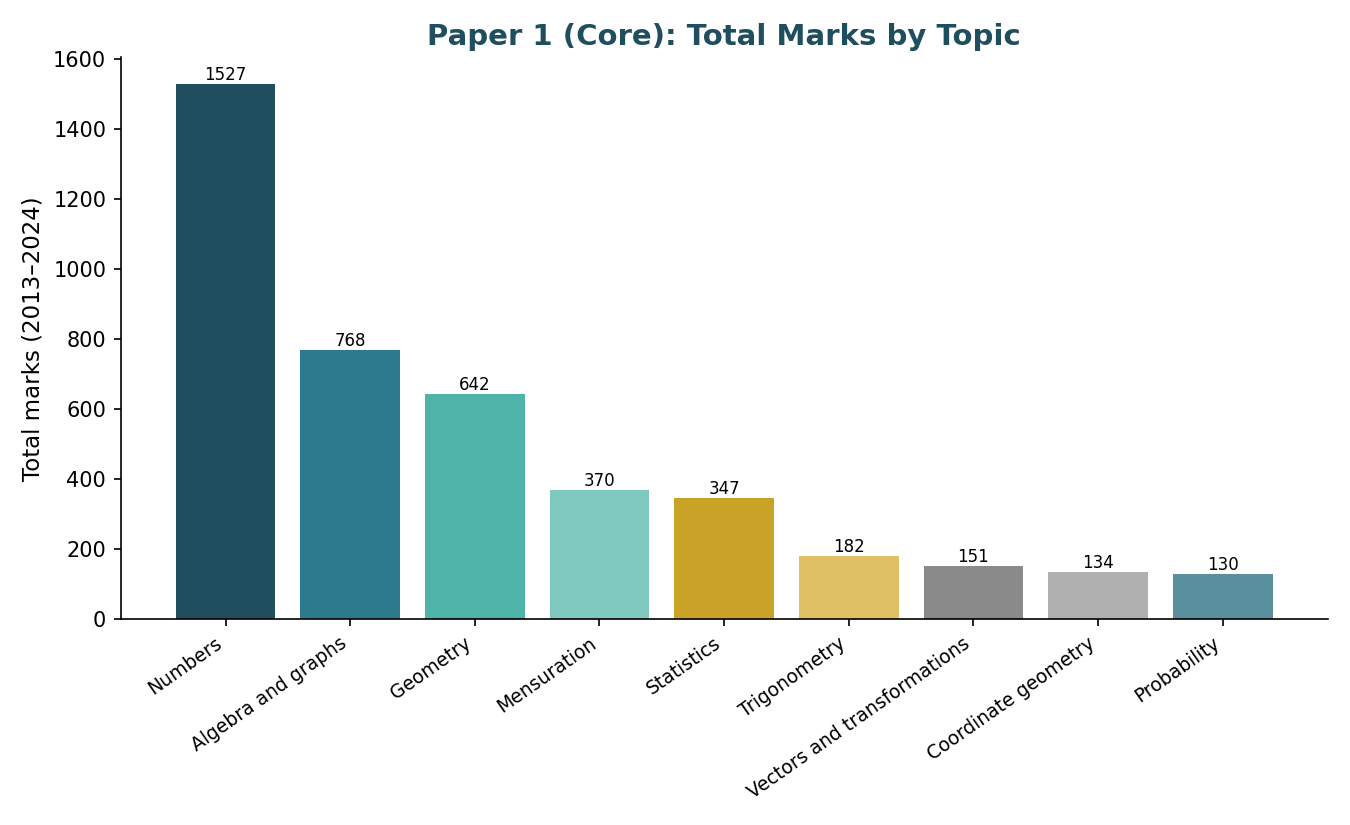
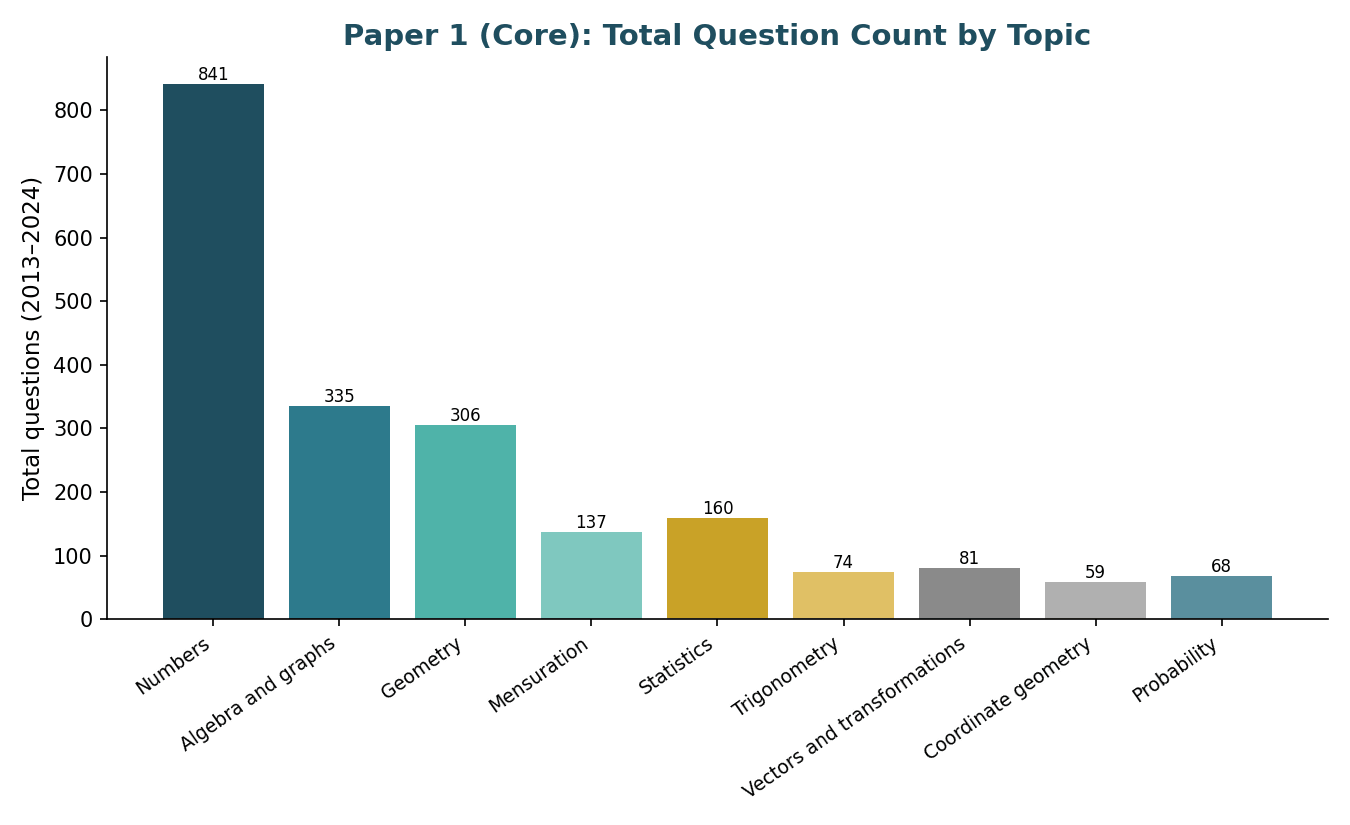
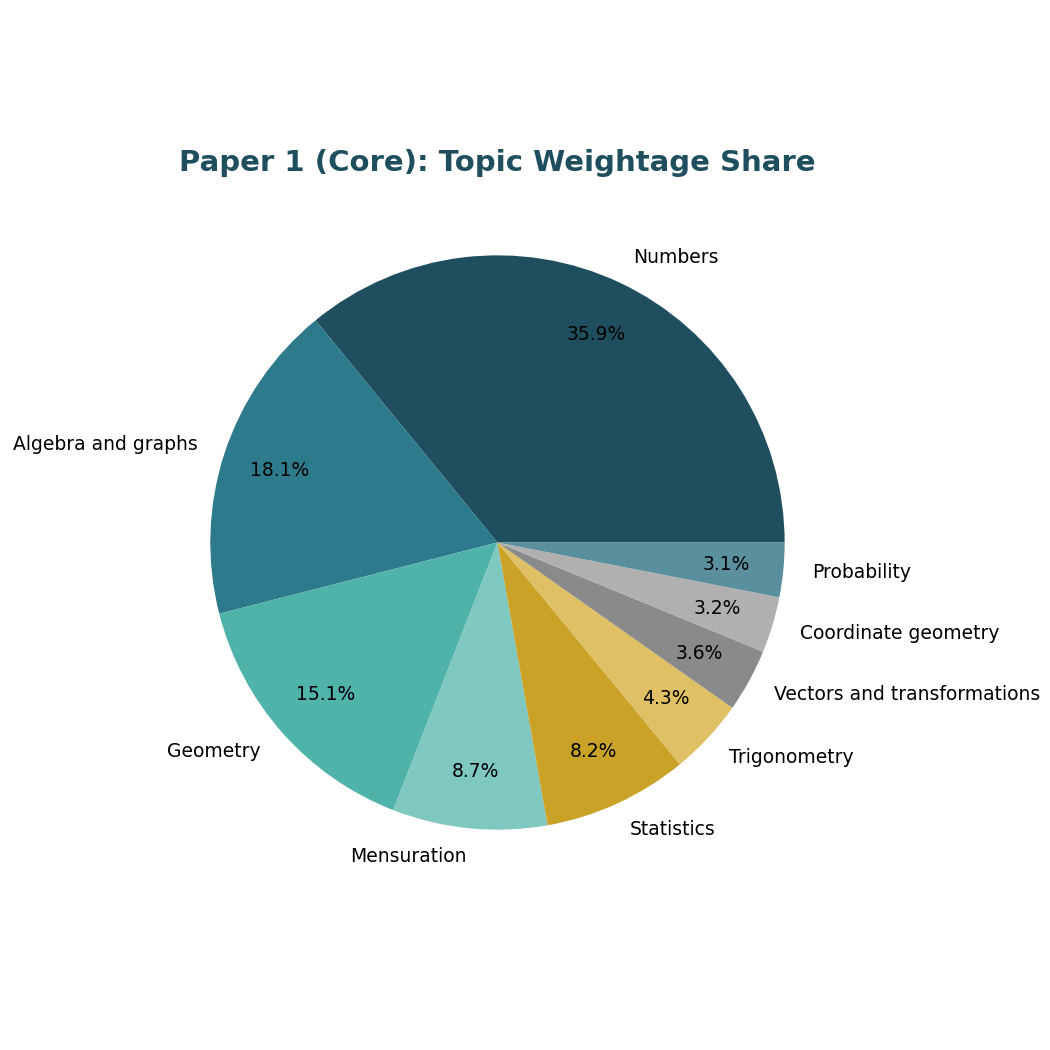
Across 2013–2024, Paper 1 has carried a total of 4,251 marks over 2,061 questions, spanning all nine Core topics. The distribution is heavily front-loaded: Numbers alone accounts for over a third of the entire paper.
Numbers (1,527 marks / 841 questions)
Numbers is the single largest topic on Paper 1 by a wide margin, contributing 35.9% of all marks and 40.8% of all questions — meaning more than two in five Paper 1 questions touch this topic in some form. At 1.82 marks per question, it sits below the paper’s overall average of 2.06, reflecting Numbers’ tendency to appear as short, discrete calculation or manipulation items rather than extended structured questions.
Algebra and graphs (768 marks / 335 questions)
The second-largest topic, Algebra and graphs holds 18.1% of marks from 16.3% of questions, at 2.29 marks per question — slightly above the paper average, indicating these questions tend to run a touch longer than typical Numbers items.
Geometry (642 marks / 306 questions)
Geometry contributes 15.1% of marks and 14.8% of questions, at 2.10 marks per question — close to the paper average, making it a consistently proportionate topic year to year.
Mensuration (370 marks / 137 questions)
Mensuration holds 8.7% of marks but only 6.6% of questions, giving it the highest marks-per-question ratio of any major topic on Paper 1 at 2.70 — Mensuration questions tend to be longer, multi-part items relative to how often they appear.
Statistics (347 marks / 160 questions)
Statistics sits close behind at 8.2% of marks and 7.8% of questions, with a marks-per-question ratio of 2.17, tracking the paper average closely.
The remaining four topics — Trigonometry (4.3% of marks), Vectors and transformations (3.6%), Coordinate geometry (3.2%), and Probability (3.1%) — together make up under 15% of the paper, but each still appears in most sessions and should not be treated as safely skippable.
Year-by-year trend (Paper 1)
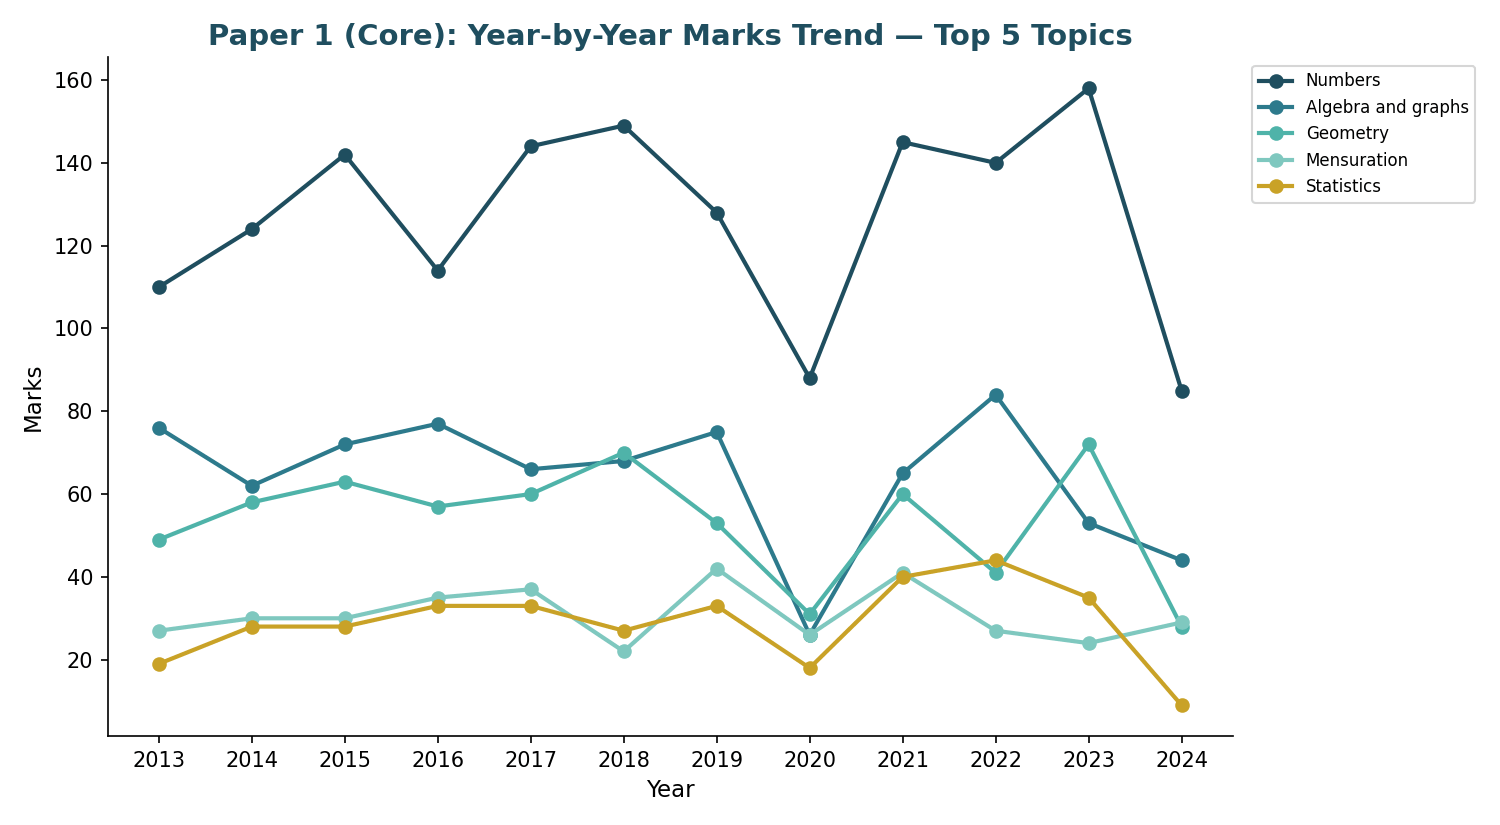
Numbers has held a consistently dominant position across all twelve years, ranging roughly between 85 and 158 marks per session, with no sustained decline. Algebra and graphs and Geometry have both stayed relatively stable year to year, while Mensuration and Statistics show more session-to-session variation. Looking at 2021–2023 (setting aside the partial 2024 data), Numbers’ share held at 38.1% of marks on average — marginally above its full 12-year average of 36.1% — while Geometry’s average share eased slightly from 15.0% to 13.8% over the same window.
Punches above its weight (high marks per question relative to how often it appears):
- Mensuration — 2.70 marks/question despite only 6.6% of total questions
- Trigonometry — 2.46 marks/question from just 3.6% of total questions
- Algebra and graphs — 2.29 marks/question, above the 2.06 paper average
Appears often but carries lighter mark value per question:
- Numbers — the most frequent topic (40.8% of questions) but the lowest marks-per-question ratio at 1.82, reflecting shorter, discrete items
- Vectors and transformations — 1.86 marks/question, below average despite regular appearances
Paper 1 summary table
| Topic | Total Marks | % of Marks | Total Questions | % of Questions | Marks/Question |
|---|---|---|---|---|---|
| Numbers | 1,527 | 35.9% | 841 | 40.8% | 1.82 |
| Algebra and graphs | 768 | 18.1% | 335 | 16.3% | 2.29 |
| Geometry | 642 | 15.1% | 306 | 14.8% | 2.10 |
| Mensuration | 370 | 8.7% | 137 | 6.6% | 2.70 |
| Statistics | 347 | 8.2% | 160 | 7.8% | 2.17 |
| Trigonometry | 182 | 4.3% | 74 | 3.6% | 2.46 |
| Vectors and transformations | 151 | 3.6% | 81 | 3.9% | 1.86 |
| Coordinate geometry | 134 | 3.2% | 59 | 2.9% | 2.27 |
| Probability | 130 | 3.1% | 68 | 3.3% | 1.91 |
Paper 3 (Core): Topic Distribution Overview
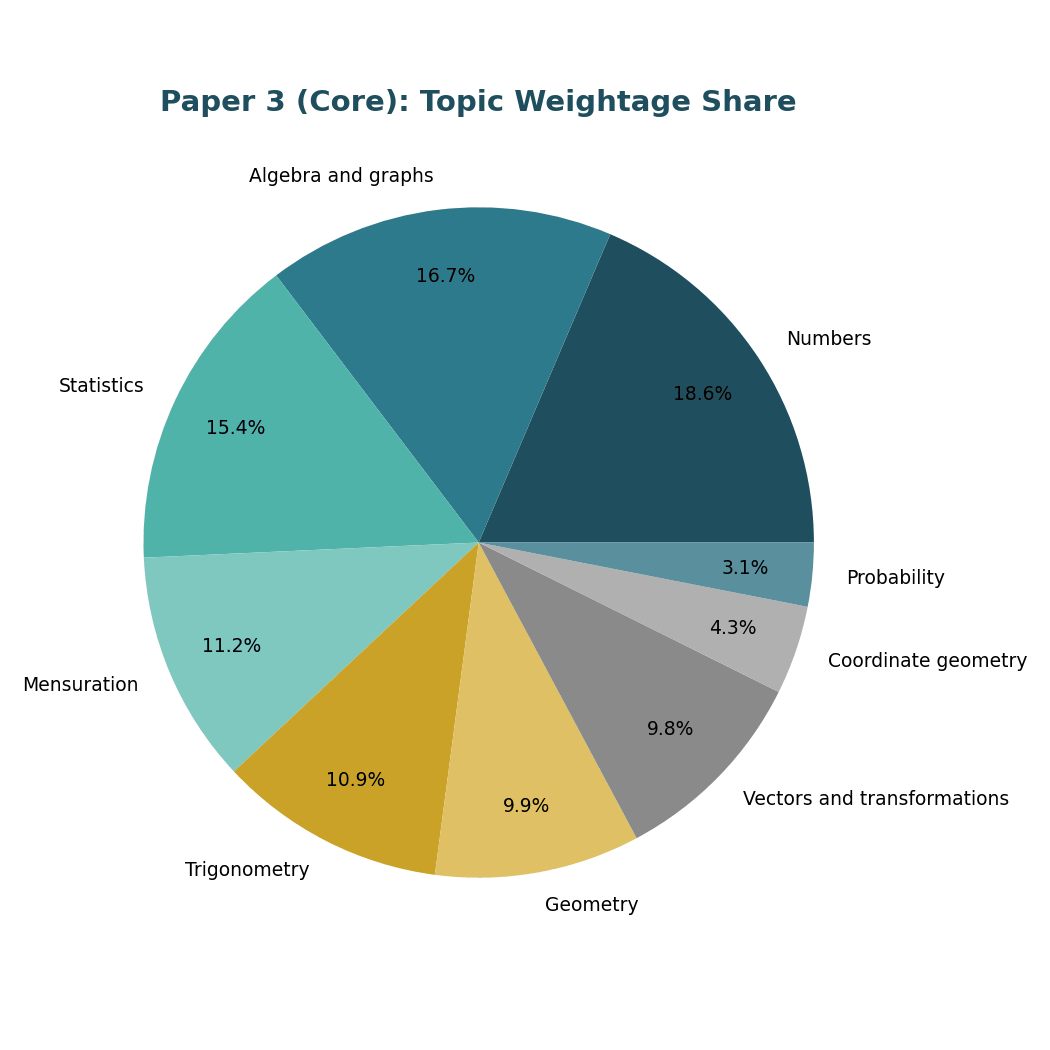
Paper 3 carries a total of 7,841 marks over 1,424 questions across 2013–2024 — nearly double Paper 1’s total marks from fewer than three-quarters as many questions, confirming its longer, structured-question format. The topic balance is notably more even than Paper 1: no single topic exceeds a fifth of the total.
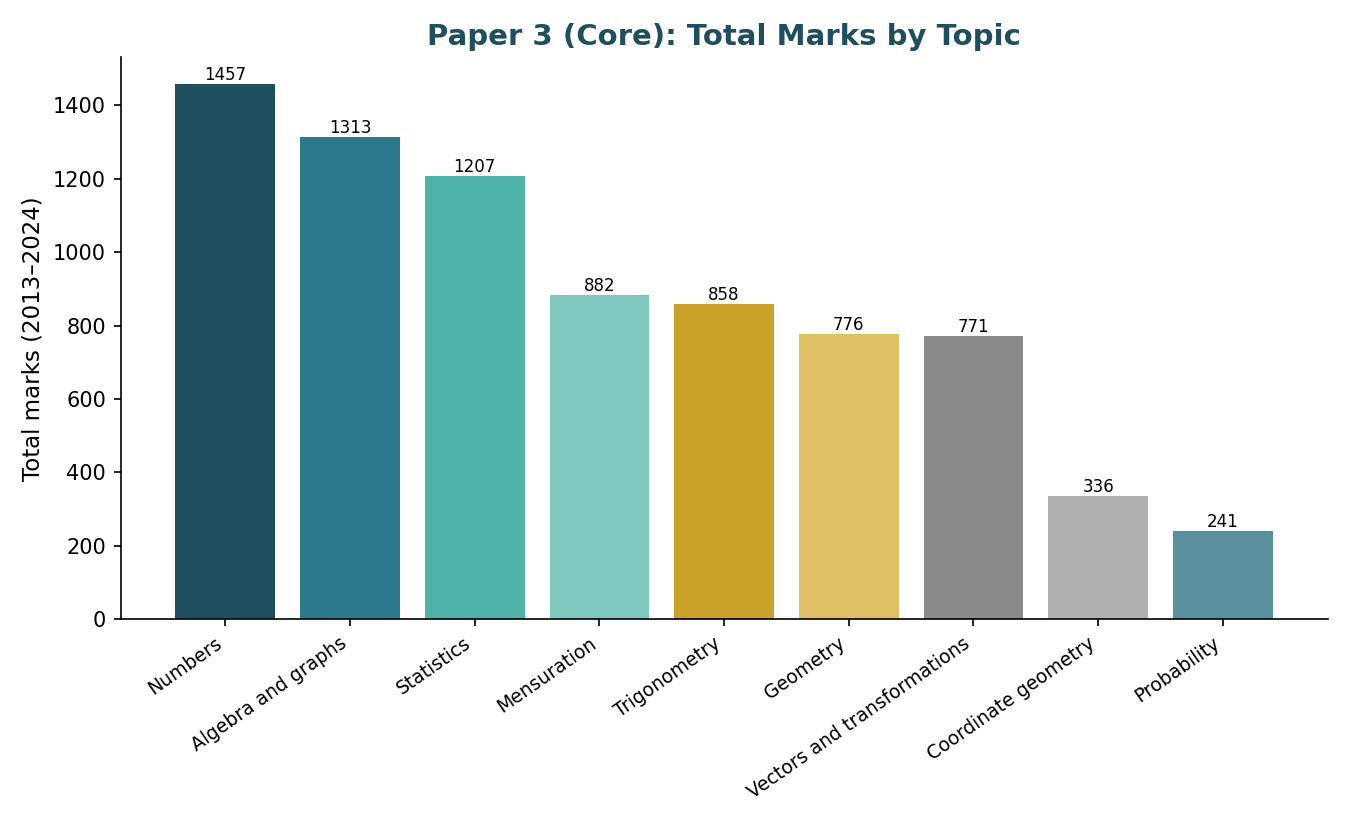
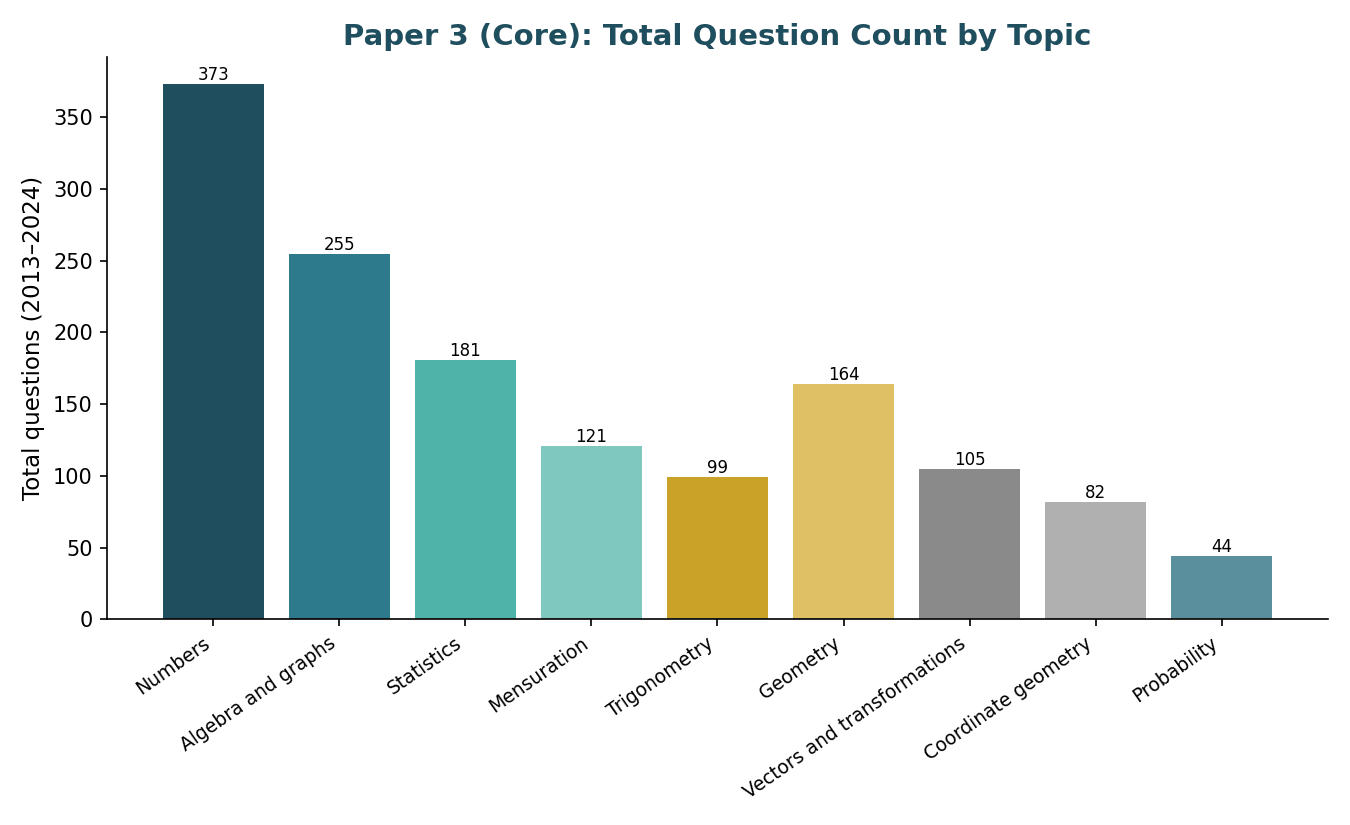
Numbers (1,457 marks / 373 questions)
Numbers remains the top-weighted topic on Paper 3 too, but far less dominantly than on Paper 1: 18.6% of marks from 26.2% of questions, giving a marks-per-question ratio of 3.91 — below the Paper 3 average of 5.51, meaning Numbers questions here tend to be shorter relative to the paper’s typical structured item.
Algebra and graphs (1,313 marks / 255 questions)
Algebra and graphs is the second-heaviest topic at 16.7% of marks and 17.9% of questions, with a ratio of 5.15 marks/question — close to the paper average.
Statistics (1,207 marks / 181 questions)
Statistics holds 15.4% of marks from just 12.7% of questions, at 6.67 marks/question — noticeably above average, reflecting Statistics’ tendency to appear as substantial, multi-part structured questions on Paper 3.
Mensuration (882 marks / 121 questions)
Mensuration contributes 11.2% of marks from only 8.5% of questions, at 7.29 marks/question — one of the highest ratios on the paper, confirming Mensuration questions here are typically long and multi-step.
Trigonometry (858 marks / 99 questions)
Trigonometry carries 10.9% of marks from just 7.0% of questions, giving it the single highest marks-per-question ratio on the paper at 8.67 — when Trigonometry appears on Paper 3, it is almost always as an extended, high-value question.
Geometry (9.9% of marks, 11.5% of questions) and Vectors and transformations (9.8% of marks, 7.4% of questions) round out the mid-tier topics, while Coordinate geometry (4.3%) and Probability (3.1%) remain the lightest-weighted areas on Paper 3, as they are on Paper 1.
Year-by-year trend (Paper 3)
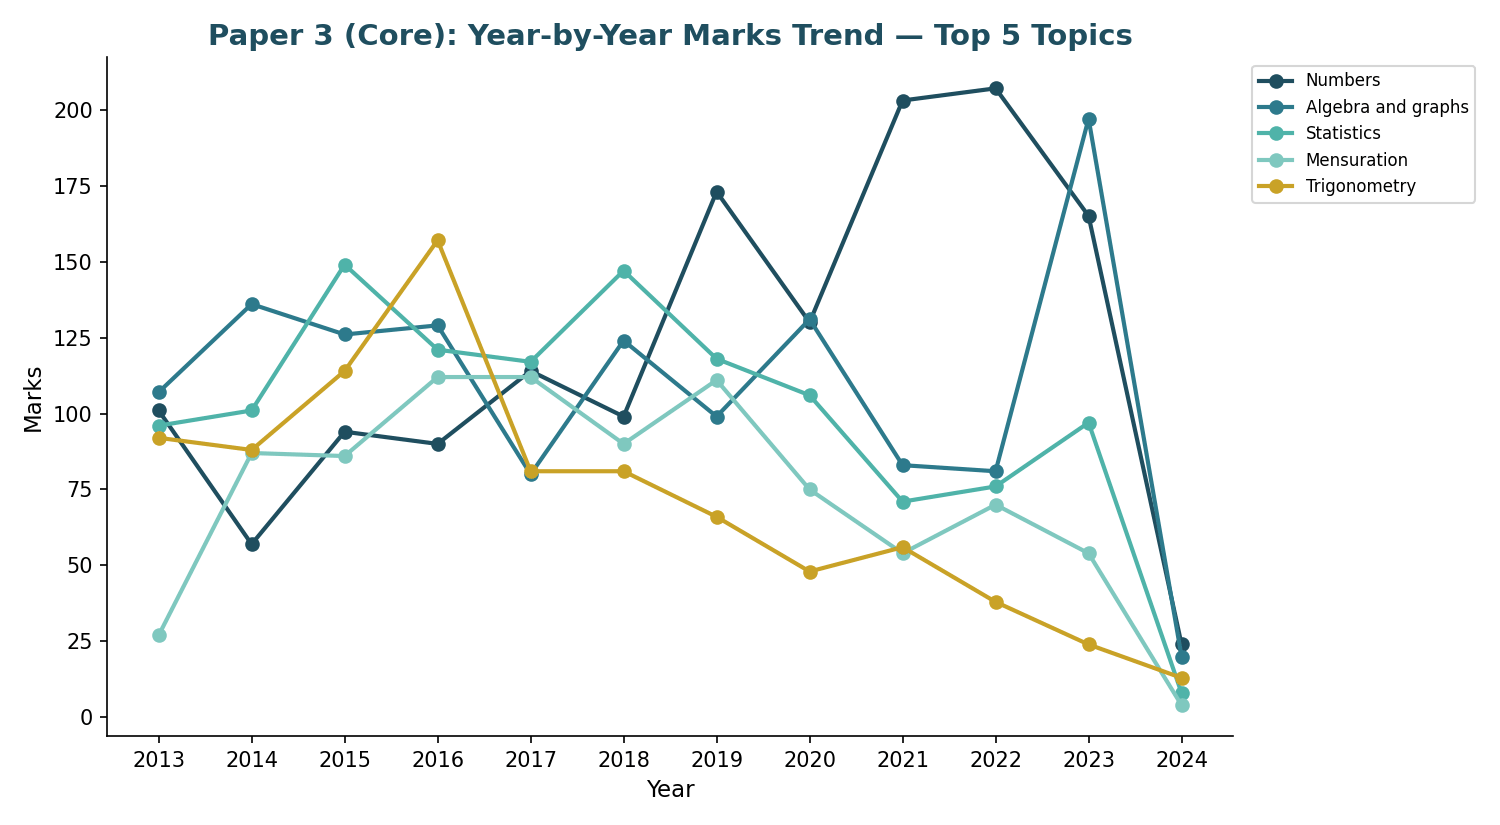
The clearest structural shift on Paper 3 is in Trigonometry, which has trended downward from a peak of 157 marks in 2016 to as low as 24 marks in 2023 (excluding the partial 2024 session) — its 2022–2023 average share of 7.0% sits well below its 12-year average of 11.2%. Geometry has moved in the opposite direction, rising from an average share of 11.0% across the full period to 17.0% in 2022–2023. Numbers has also strengthened recently, averaging 24.8% of marks in 2022–2023 versus an 18.8% long-run average, while Statistics and Mensuration have both eased back from their historical norms.
Punches above its weight (high marks per question relative to how often it appears):
- Trigonometry — 8.67 marks/question, the highest ratio on the paper, from only 7.0% of questions
- Mensuration — 7.29 marks/question against 8.5% of questions
- Vectors and transformations — 7.34 marks/question, well above the 5.51 paper average
- Statistics — 6.67 marks/question, above average despite a below-average share of questions
Appears often but carries lighter mark value per question:
- Numbers — the most frequent topic (26.2% of questions) but a below-average ratio of 3.91 marks/question
- Coordinate geometry — 4.10 marks/question, the second-lowest ratio on the paper
Paper 3 summary table
| Topic | Total Marks | % of Marks | Total Questions | % of Questions | Marks/Question |
|---|---|---|---|---|---|
| Numbers | 1,457 | 18.6% | 373 | 26.2% | 3.91 |
| Algebra and graphs | 1,313 | 16.7% | 255 | 17.9% | 5.15 |
| Statistics | 1,207 | 15.4% | 181 | 12.7% | 6.67 |
| Mensuration | 882 | 11.2% | 121 | 8.5% | 7.29 |
| Trigonometry | 858 | 10.9% | 99 | 7.0% | 8.67 |
| Geometry | 776 | 9.9% | 164 | 11.5% | 4.73 |
| Vectors and transformations | 771 | 9.8% | 105 | 7.4% | 7.34 |
| Coordinate geometry | 336 | 4.3% | 82 | 5.8% | 4.10 |
| Probability | 241 | 3.1% | 44 | 3.1% | 5.48 |
Paper 1 vs Paper 3: Joint Analysis
Placed side by side, the two Core papers reward genuinely different preparation. Paper 1 concentrates over half its marks (54.0%) in just two topics — Numbers and Algebra and graphs — while Paper 3 spreads its weight far more evenly across all nine areas, with its top two topics accounting for only 35.3% of marks.
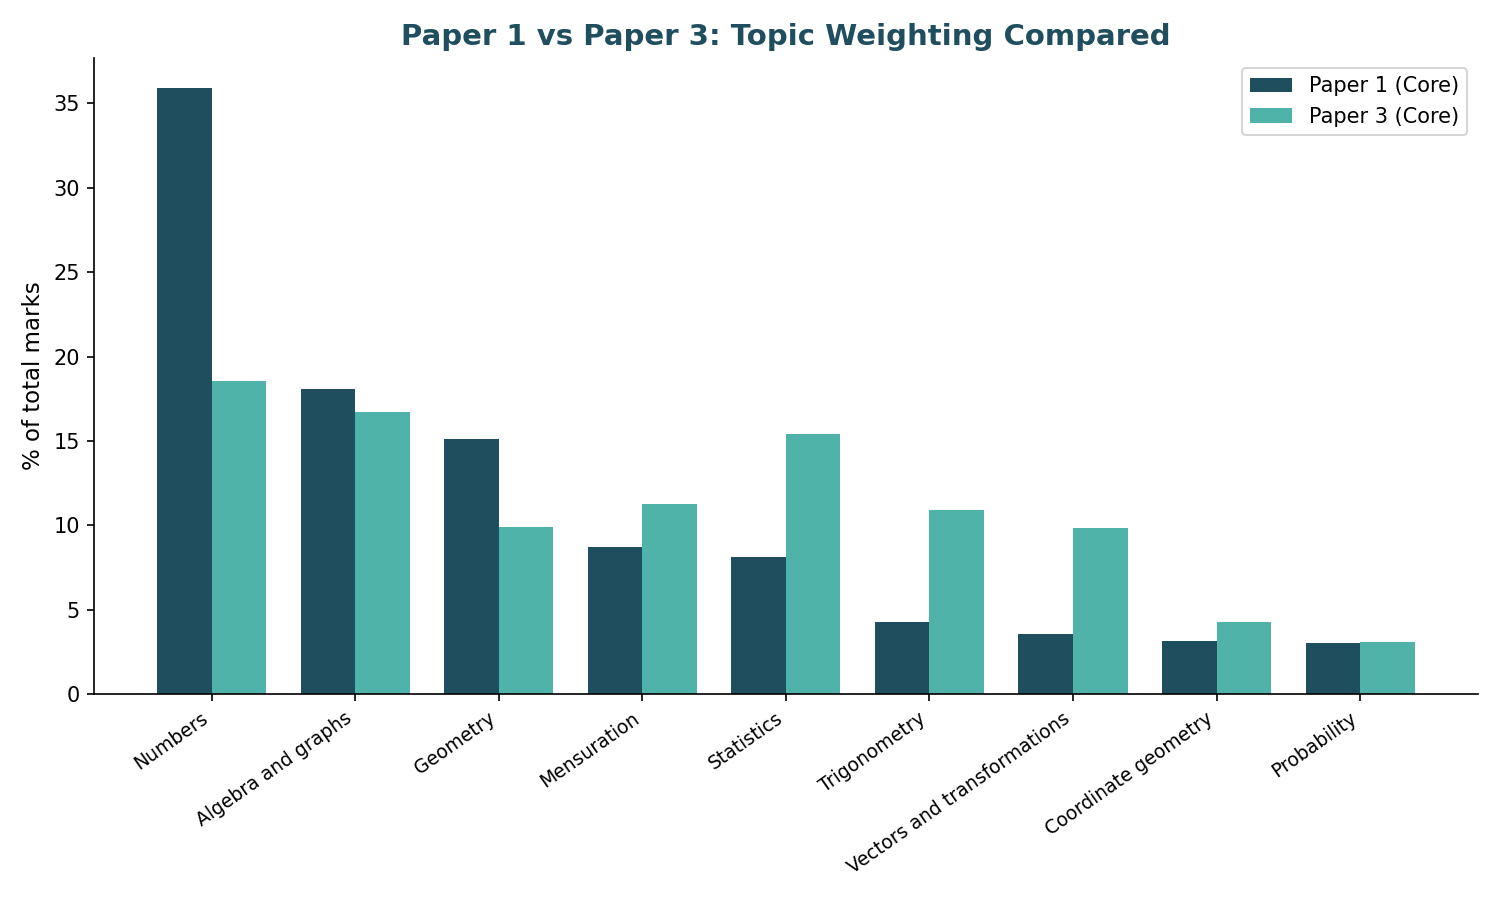
Numbers is the single largest topic on both papers, but its dominance is far sharper on Paper 1 (35.9% of marks) than on Paper 3 (18.6%) — nearly double the weighting. This makes sense given Paper 1’s non-calculator, shorter-question format, which favours discrete numerical skills, while Paper 3’s longer structured questions give more room for other topics to carry equal or greater weight.
The most striking paper-specific pattern is Trigonometry: it holds a modest 4.3% of marks on Paper 1 but 10.9% on Paper 3 — one of the largest weighting gaps between the two papers — and carries by far the highest marks-per-question ratio of any topic on either paper (8.67 on Paper 3). Students who under-prepare Trigonometry because it feels minor on Paper 1 practice are likely underestimating its role on Paper 3. Mensuration and Vectors and transformations show a similar, if smaller, pattern — both roughly 2–3 percentage points heavier on Paper 3 than Paper 1.
Conversely, Geometry is fairly close in weighting between the two papers (15.1% on Paper 1 vs 9.9% on Paper 3), while Coordinate geometry and Probability remain consistently minor on both — under 6% of marks in every case — making them the lowest-priority topics across the whole Core syllabus by this measure, though still worth basic familiarity given their steady, if small, presence every year.
Focus Areas for Upcoming Exams
Based on twelve years of combined Paper 1 and Paper 3 data, these are the areas that have consistently carried the most weight — and the ones most likely to be under-practised relative to their importance:
- Numbers — the single heaviest topic on both papers; especially critical for Paper 1, where it alone accounts for over a third of all marks.
- Algebra and graphs — consistently the second-largest topic on both papers, with a stable share across all twelve years.
- Trigonometry on Paper 3 — easy to under-rate from Paper 1 practice alone, but the highest marks-per-question topic on Paper 3, worth dedicated structured-question practice.
- Mensuration and Statistics on Paper 3 — both punch well above their question frequency in marks value; strong candidates for extended-question drilling.
- Geometry — a solid, evenly-weighted topic on both papers that rewards steady, rather than last-minute, revision.
These are patterns from past data, not predictions — but they offer a data-informed starting point for allocating revision time across both Core papers.
Cambridge IGCSE Mathematics (0580) Extended: Topic Trend Analysis for Paper 2 & Paper 4
Cambridge IGCSE Mathematics (0580) Extended candidates sit two very different papers: Paper 2, a shorter non-calculator-style paper testing core technique, and Paper 4, the longer extended-response paper that carries most of the syllabus’s total marks. This report breaks down exactly how marks and questions have been distributed across the nine syllabus topics on each paper, tracks how that distribution has shifted year by year, and compares the two papers directly over the years they share in common. The goal is to help students and teachers prioritise revision time based on where the marks have actually been concentrated historically.
Paper 2 (Extended): Topic Distribution, 2020–2024
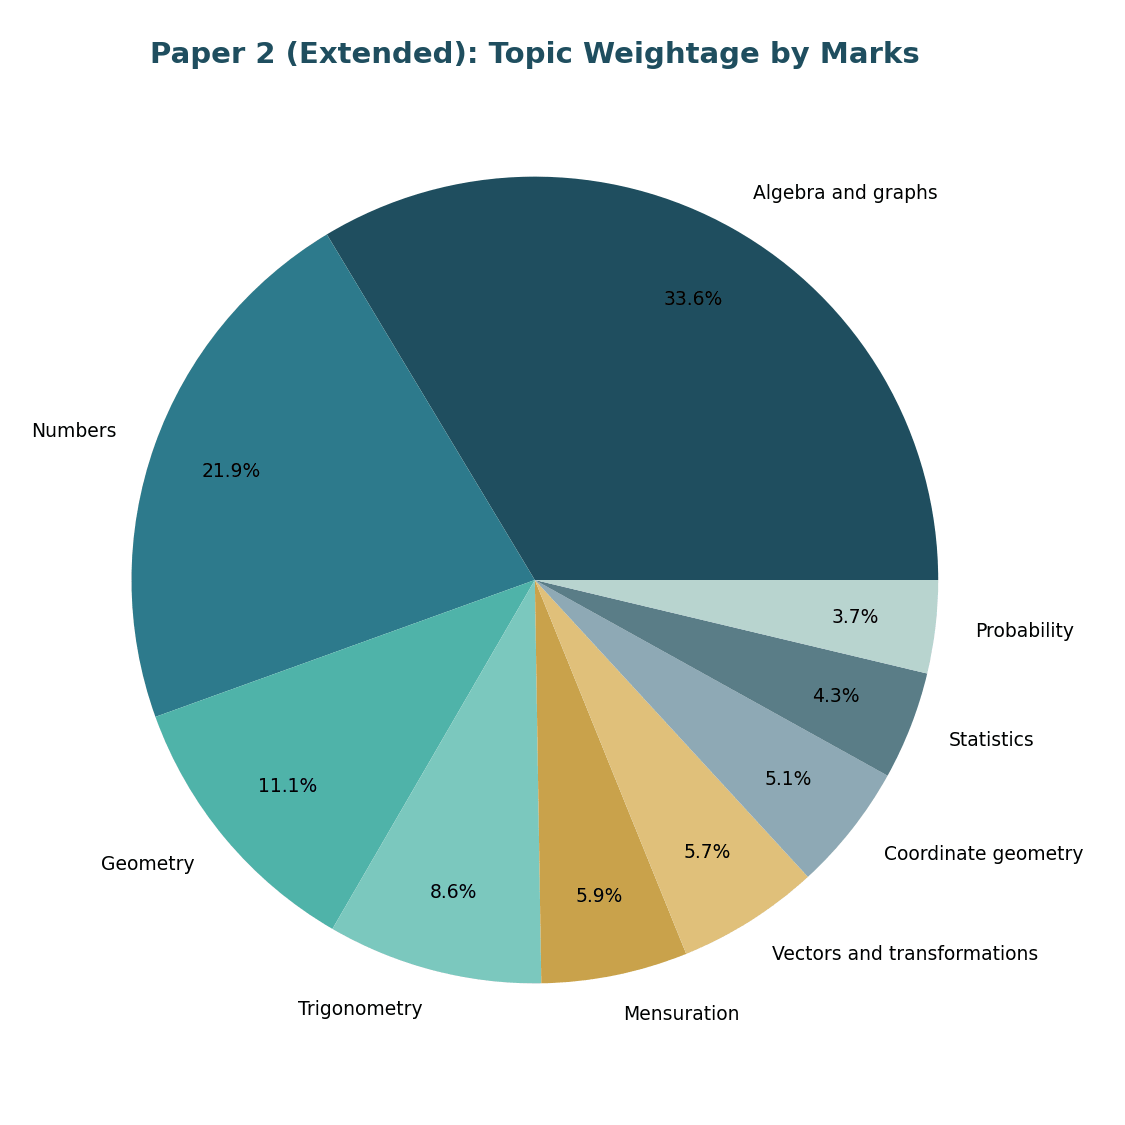
Paper 2 is the shorter of the two Extended papers, and its five years of available data (2020–2024) show a syllabus that leans heavily on two topics. Algebra and graphs is by far the dominant topic, accounting for 659 of the paper’s 1,960 total marks (33.6%) and 281 of 890 questions (31.6%) — meaning roughly a third of both the marks and the question count on Paper 2 come from this single strand. Numbers is a clear second, contributing 429 marks (21.9%) across 233 questions (26.2%). Together, Algebra and graphs plus Numbers make up 55.5% of all marks on Paper 2 — over half the paper.
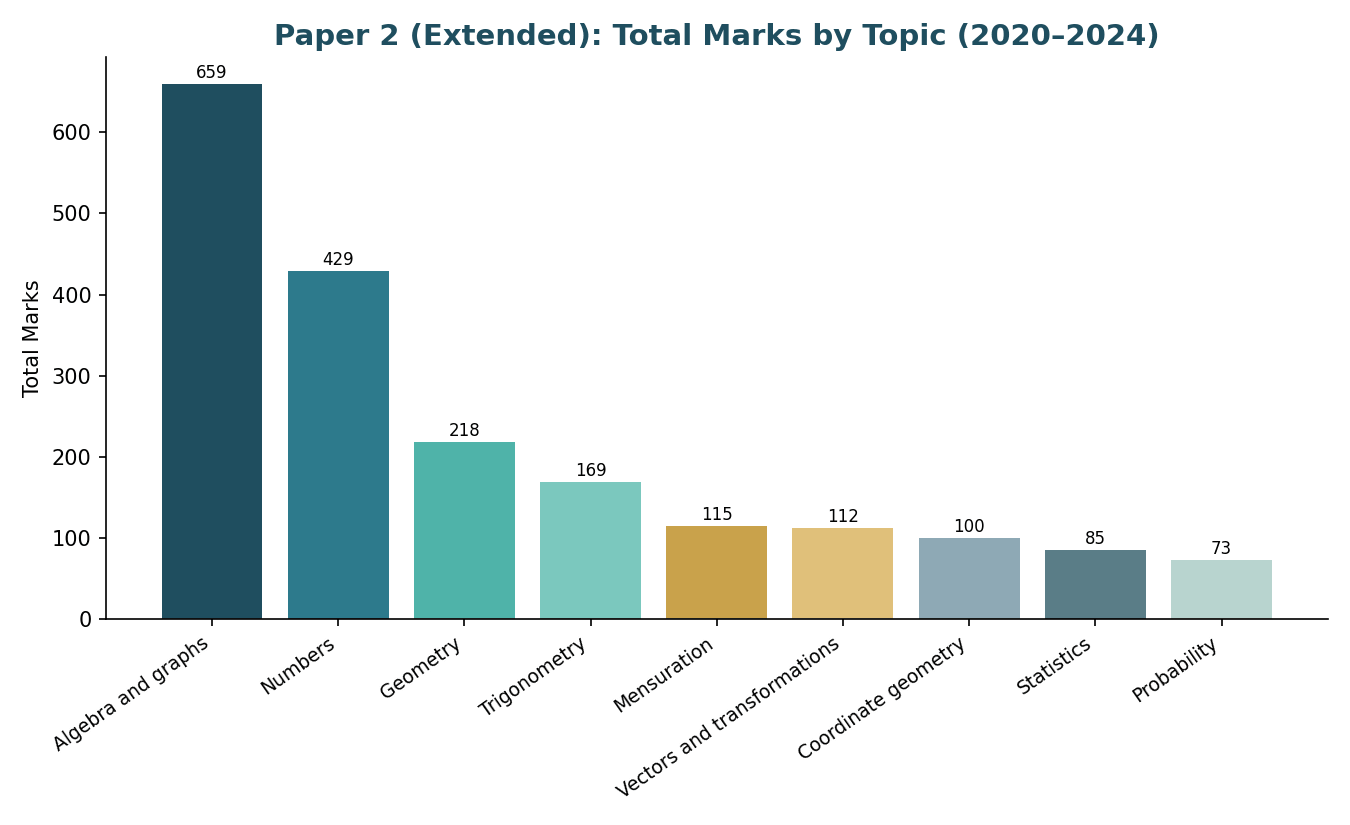
Behind these two leaders, Geometry holds a solid third place with 218 marks (11.1%) from 97 questions, followed by Trigonometry at 169 marks (8.6%) and Mensuration at 115 marks (5.9%). The remaining four topics — Vectors and transformations, Coordinate geometry, Statistics, and Probability — each sit in a narrower 3.7%–5.7% band of total marks, none individually decisive but collectively still worth a fifth of the paper.
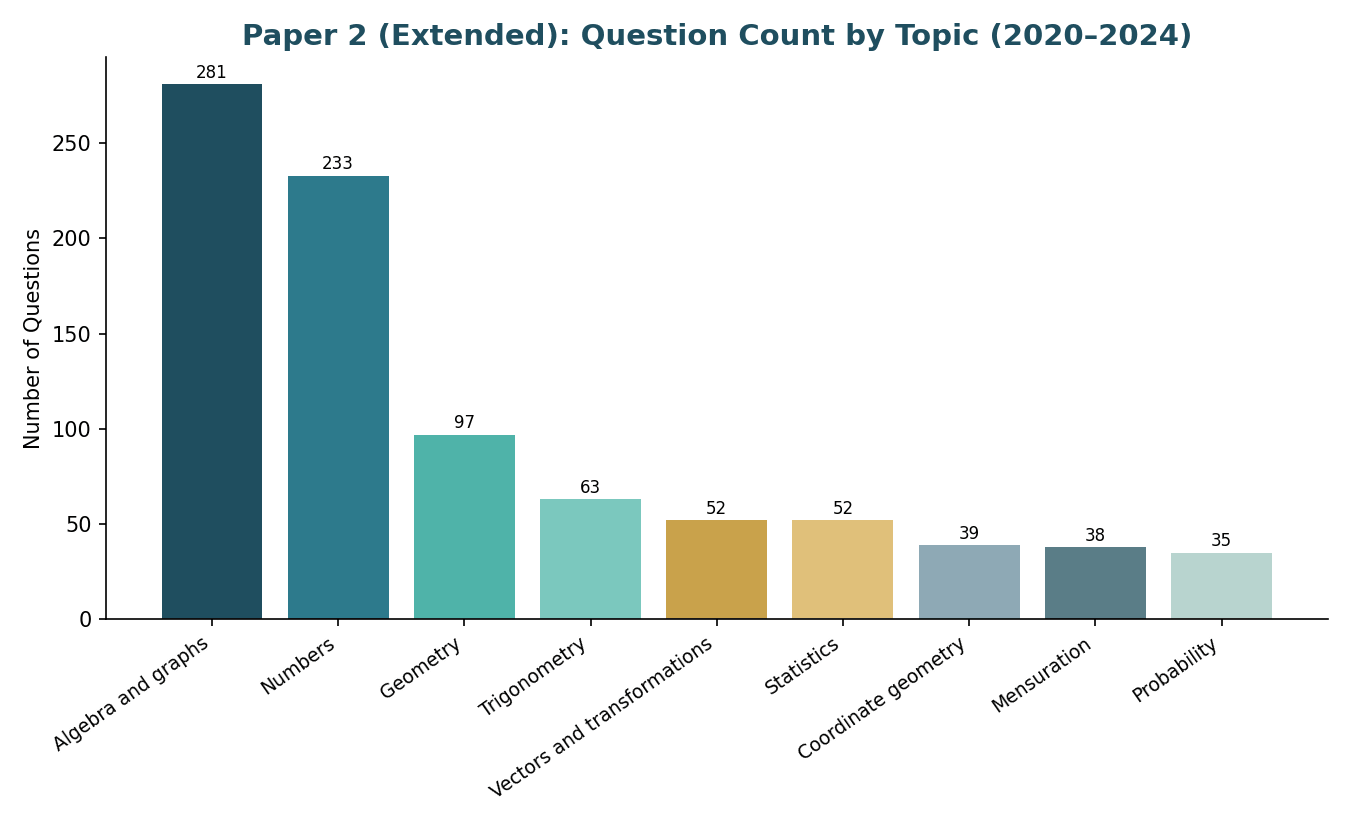
Where marks and question frequency diverge (Paper 2)
Total marks and question count usually move together, but the marks-per-question ratio reveals which topics are worth more per question attempted — useful for prioritising practice when time is short.
- Mensuration — 3.03 marks/question (115 marks across just 38 questions), the richest per-question topic on the paper
- Trigonometry — 2.68 marks/question (169 marks / 63 questions)
- Coordinate geometry — 2.56 marks/question (100 marks / 39 questions)
- Statistics — only 1.63 marks/question (85 marks spread across 52 questions), the lowest ratio on the paper
- Numbers — 1.84 marks/question despite being the second-largest topic by both marks and question count (429 marks / 233 questions)
In practice, this means Mensuration and Trigonometry questions tend to be longer, multi-step problems worth securing fully once attempted, while Numbers and Statistics questions are more numerous but individually lighter — useful for building exam-timing strategy as much as content revision.
Year-by-year trend (Paper 2, top 5 topics)
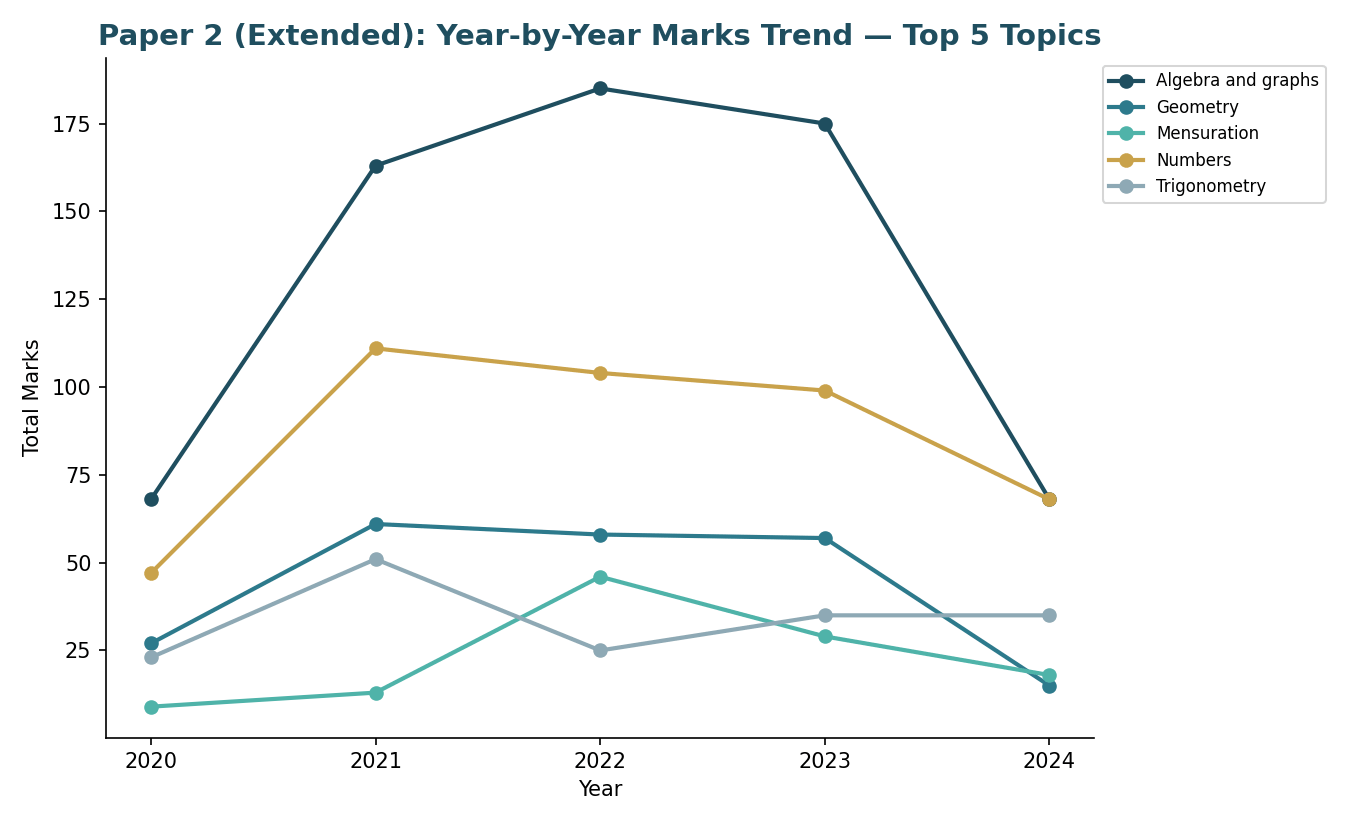
Looking at the top five topics by marks across the five available years shows Algebra and graphs consistently leading every session, though its absolute mark total has varied — from a low of 68 marks in 2020 and again in 2024, up to a peak of 185 marks in 2022. Numbers has stayed comparatively stable, ranging between 47 and 111 marks per session with no clear upward or downward drift. Geometry and Trigonometry both show mild year-to-year variation without a sustained trend in either direction, while Mensuration’s 2022 spike to 46 marks (compared with 9–29 marks in other years) stands out as the paper’s most volatile topic.
Paper 2 summary table
| Topic | Total Marks | % of Marks | Questions | % of Questions | Marks/Question |
|---|---|---|---|---|---|
| Algebra and graphs | 659 | 33.6% | 281 | 31.6% | 2.35 |
| Numbers | 429 | 21.9% | 233 | 26.2% | 1.84 |
| Geometry | 218 | 11.1% | 97 | 10.9% | 2.25 |
| Trigonometry | 169 | 8.6% | 63 | 7.1% | 2.68 |
| Mensuration | 115 | 5.9% | 38 | 4.3% | 3.03 |
| Vectors and transformations | 112 | 5.7% | 52 | 5.8% | 2.15 |
| Coordinate geometry | 100 | 5.1% | 39 | 4.4% | 2.56 |
| Statistics | 85 | 4.3% | 52 | 5.8% | 1.63 |
| Probability | 73 | 3.7% | 35 | 3.9% | 2.09 |
Paper 4 (Extended): Topic Distribution, 2013–2024
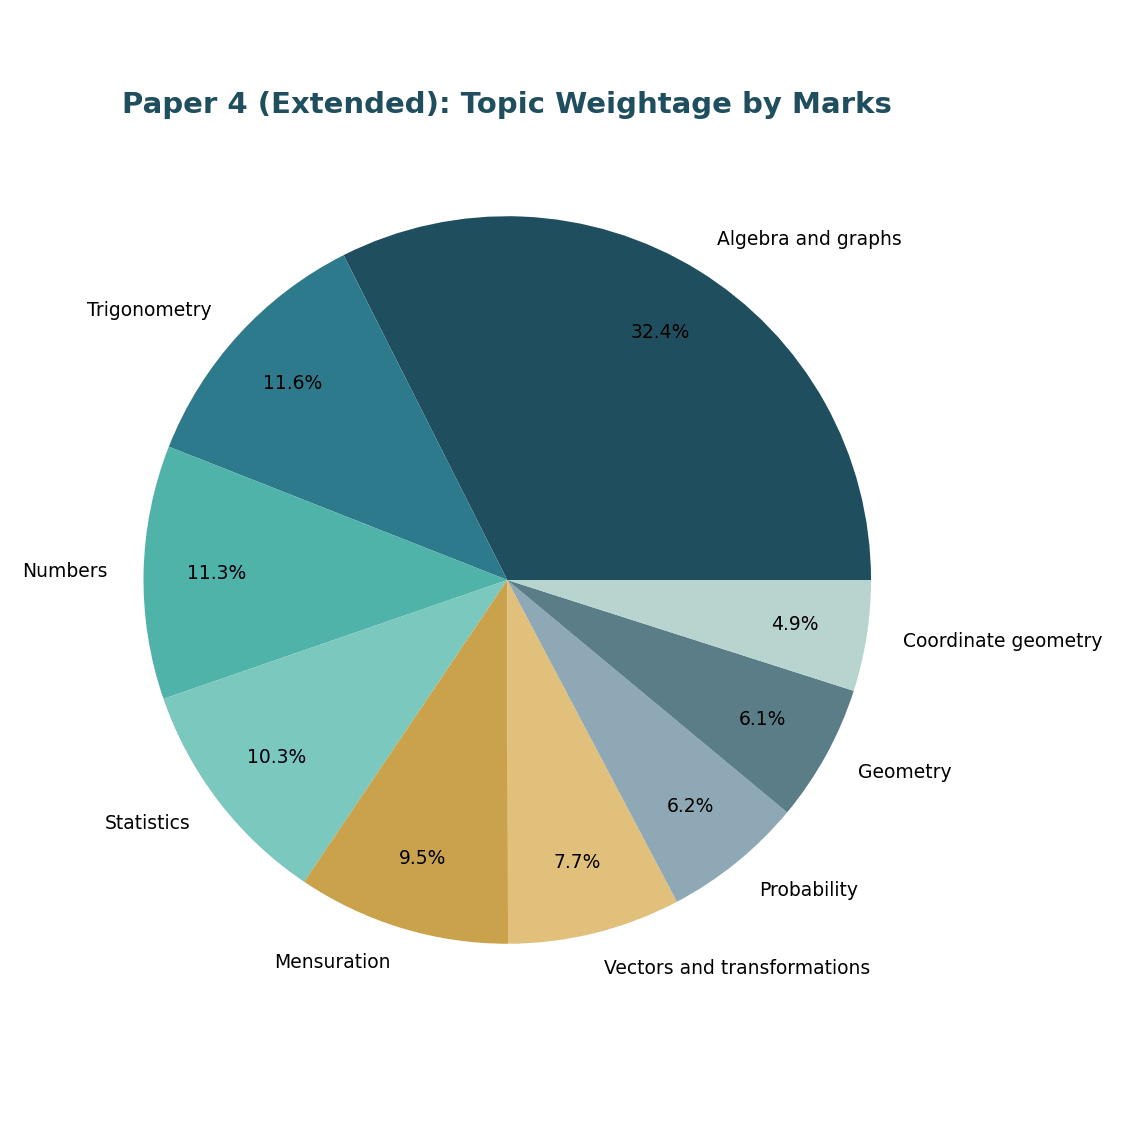
Paper 4 carries far more total marks and spans a much longer twelve-year data set (2013–2024), giving a more statistically stable picture of long-run topic weighting. As on Paper 2, Algebra and graphs is the clear leader: 3,125 of the paper’s 9,637 total marks (32.4%) across 427 of 1,370 questions (31.2%) — remarkably close to its 33.6% share on Paper 2, suggesting this topic’s dominance is a structural feature of the syllabus rather than a paper-specific quirk.
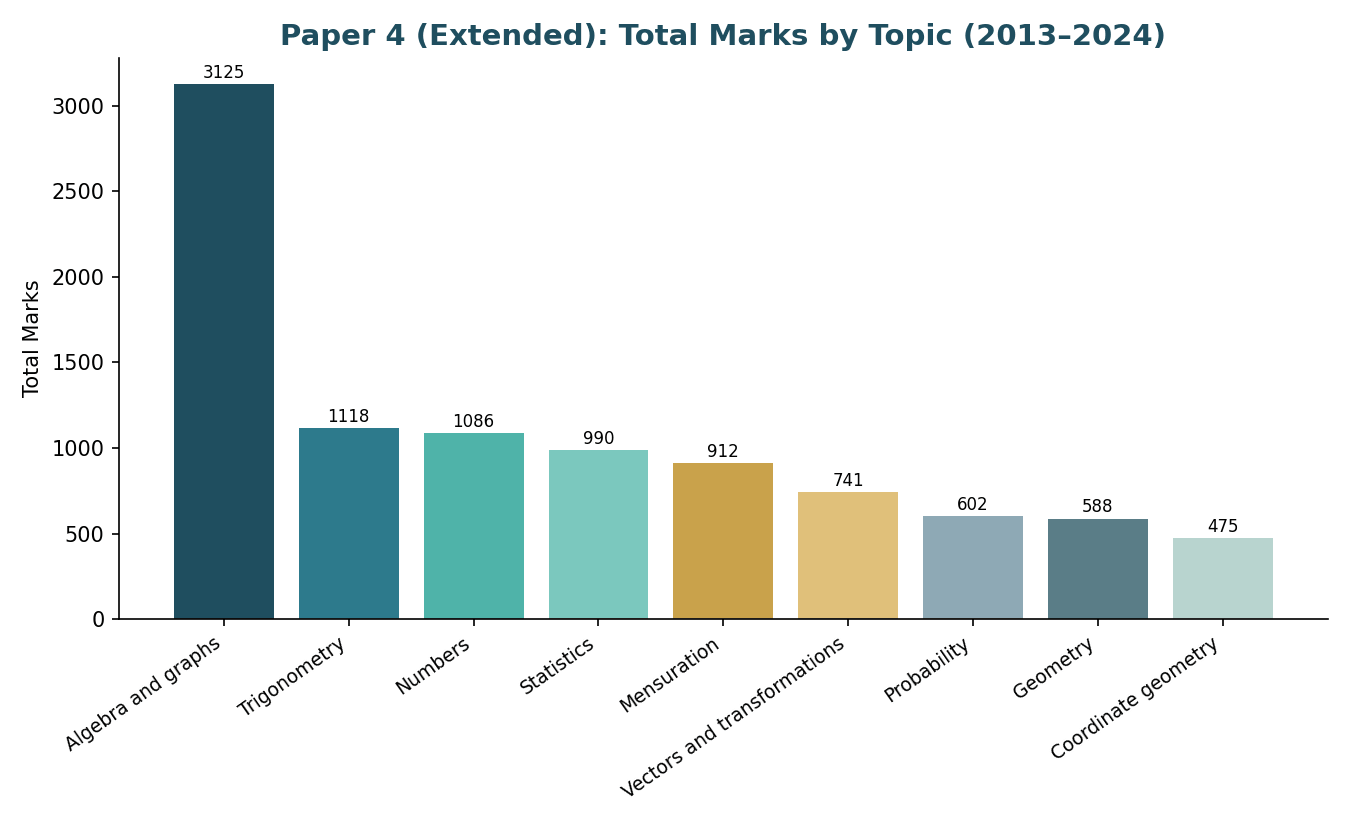
The order below Algebra and graphs looks different from Paper 2, however. Trigonometry ranks second on Paper 4 with 1,118 marks (11.6%) from 146 questions, followed closely by Numbers at 1,086 marks (11.3%) and Statistics at 990 marks (10.3%). Mensuration contributes 912 marks (9.5%), while Vectors and transformations, Probability, Geometry, and Coordinate geometry each fall in a tighter 4.9%–7.7% band. Notably, Statistics carries almost 2.5 times the mark share on Paper 4 (10.3%) that it does on Paper 2 (4.3%) — a pattern worth flagging for students who might otherwise under-revise it based on Paper 2 alone.
Where marks and question frequency diverge (Paper 4)
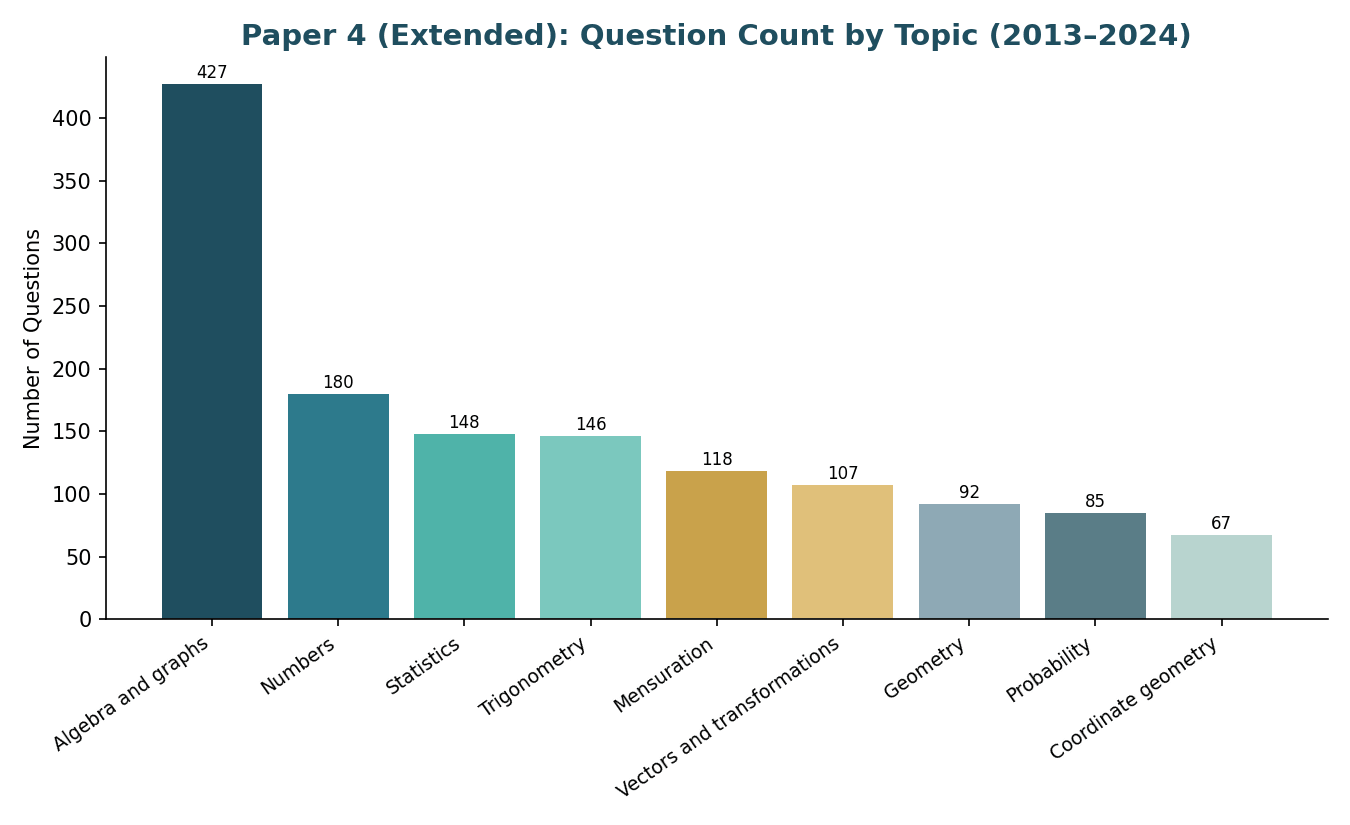
- Mensuration — 7.73 marks/question (912 marks / 118 questions), the richest per-question topic on Paper 4, consistent with its Paper 2 pattern
- Trigonometry — 7.66 marks/question (1,118 marks / 146 questions)
- Algebra and graphs — 7.32 marks/question, high value combined with high frequency, making it doubly important
- Numbers — only 6.03 marks/question (1,086 marks across 180 questions), the lowest ratio on the paper, and the same relative pattern seen on Paper 2
- Geometry — 6.39 marks/question (588 marks / 92 questions), below the paper’s average of roughly 7.04 marks/question
The consistency of Mensuration and Numbers holding their relative positions — Mensuration always richest per question, Numbers always leanest — across both a five-year and a twelve-year data set strengthens confidence that this is a genuine structural pattern in how the syllabus is examined, not statistical noise from a small sample.
Year-by-year trend (Paper 4, top 5 topics)
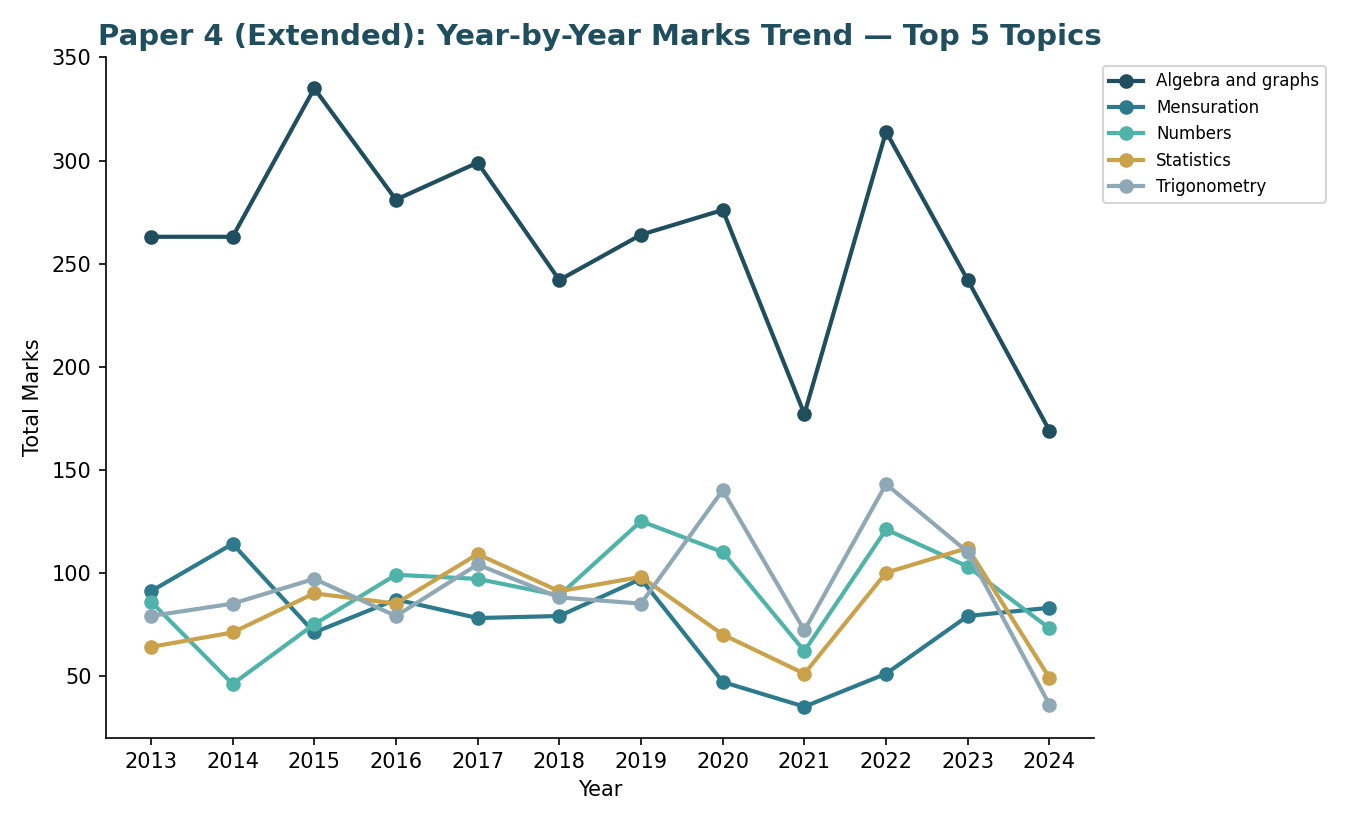
Across twelve years, Algebra and graphs has ranged from a low of 169 marks in 2024 to a high of 335 marks in 2015, but has stayed the top-weighted topic in nearly every session. Trigonometry shows the most dramatic recent swings: it climbed to 140 marks in 2020 and 143 marks in 2022 — well above its 2013–2019 average of roughly 85–104 marks — before falling sharply to just 36 marks in 2024, its lowest point in the entire data set. Statistics has fluctuated between 49 and 112 marks with a mild long-run upward drift through the late 2010s before a dip in 2024. Numbers and Mensuration have both stayed comparatively range-bound without a strong directional trend.
Paper 4 summary table
| Topic | Total Marks | % of Marks | Questions | % of Questions | Marks/Question |
|---|---|---|---|---|---|
| Algebra and graphs | 3,125 | 32.4% | 427 | 31.2% | 7.32 |
| Trigonometry | 1,118 | 11.6% | 146 | 10.7% | 7.66 |
| Numbers | 1,086 | 11.3% | 180 | 13.1% | 6.03 |
| Statistics | 990 | 10.3% | 148 | 10.8% | 6.69 |
| Mensuration | 912 | 9.5% | 118 | 8.6% | 7.73 |
| Vectors and transformations | 741 | 7.7% | 107 | 7.8% | 6.93 |
| Probability | 602 | 6.2% | 85 | 6.2% | 7.08 |
| Geometry | 588 | 6.1% | 92 | 6.7% | 6.39 |
| Coordinate geometry | 475 | 4.9% | 67 | 4.9% | 7.09 |
Joint Analysis: Paper 2 vs Paper 4
Because Paper 2’s data only covers 2020–2024, the fairest cross-paper comparison restricts Paper 4 to that same five-year window rather than its full twelve-year history. Over 2020–2024, Paper 4 recorded 3,712 marks across 901 questions, against Paper 2’s 1,960 marks across 890 questions in the same span — confirming that Paper 4 carries roughly 1.9 times the mark value of Paper 2 even over an identical set of years, consistent with its role as the longer extended-response paper.
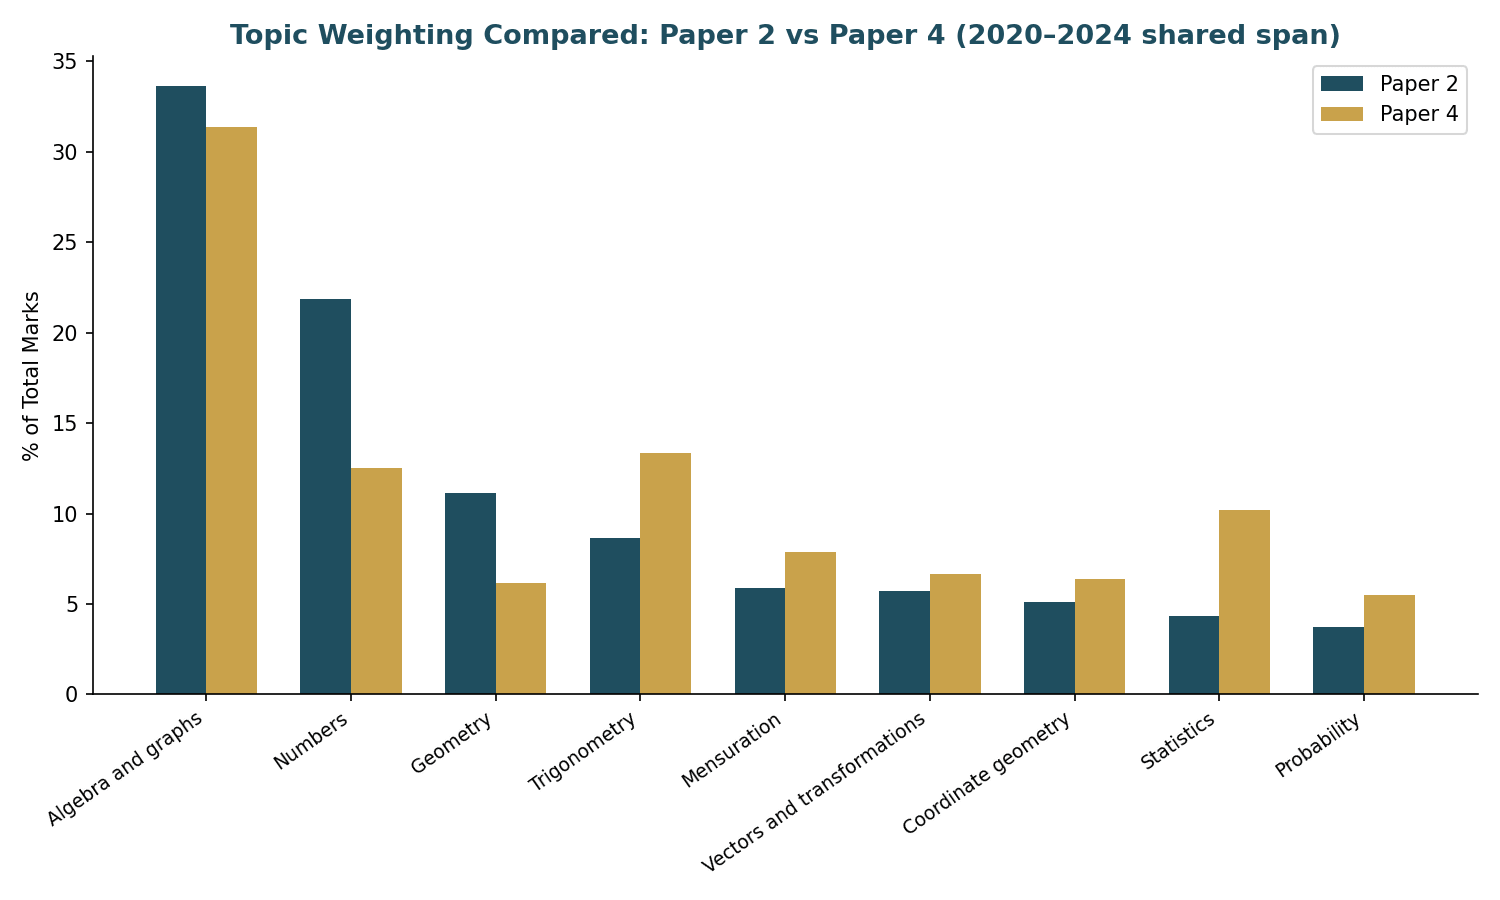
Algebra and graphs is the one topic that behaves almost identically on both papers: 33.6% of marks on Paper 2 versus 31.4% on Paper 4 over the same years — a difference of only 2.2 percentage points. This makes it the single most reliably high-value topic across the entire 0580 Extended syllabus, regardless of which paper a student is preparing for.
The biggest divergences run in opposite directions. Numbers carries nearly double the relative weight on Paper 2 (21.9%) that it does on Paper 4 over the shared span (12.5%) — a gap of 9.4 percentage points, the largest of any topic. Geometry shows a similar, smaller pattern: 11.1% on Paper 2 against 6.2% on Paper 4. Both topics appear to be tested more heavily through shorter, more numerous questions on Paper 2, and more sparingly — though likely at greater depth per question — on Paper 4.
In the other direction, Statistics is proportionally far more significant on Paper 4 (10.2% over the shared span) than on Paper 2 (4.3%), a gap of 5.8 percentage points. Trigonometry follows the same pattern: 13.4% on Paper 4 versus 8.6% on Paper 2, a difference of 4.7 points. Both topics appear to shift toward longer, extended-response-style questions on Paper 4 rather than being tested as frequently in Paper 2’s shorter format.
Topic-by-topic, none of the nine syllabus areas is entirely absent from either paper — every topic appears in both data sets across the shared span, so there’s no case of a topic being “Paper 4 only” or “Paper 2 only.” The differences are ones of relative emphasis rather than presence, which supports a revision strategy built around the full syllabus with weighting adjusted by paper rather than one that skips any topic entirely.
| Topic | Paper 2 % Marks (2020–24) | Paper 4 % Marks (2020–24) | Difference |
|---|---|---|---|
| Algebra and graphs | 33.6% | 31.4% | +2.2 pts (P2) |
| Numbers | 21.9% | 12.5% | +9.4 pts (P2) |
| Geometry | 11.1% | 6.2% | +5.0 pts (P2) |
| Trigonometry | 8.6% | 13.4% | +4.7 pts (P4) |
| Statistics | 4.3% | 10.2% | +5.8 pts (P4) |
| Mensuration | 5.9% | 7.9% | +2.0 pts (P4) |
| Coordinate geometry | 5.1% | 6.4% | +1.3 pts (P4) |
| Probability | 3.7% | 5.5% | +1.8 pts (P4) |
| Vectors and transformations | 5.7% | 6.7% | +0.9 pts (P4) |
Focus areas for upcoming exams
Across both papers, a small set of consistent patterns stands out from the historical data:
- Algebra and graphs is the highest-value topic on both Paper 2 and Paper 4, holding a near-identical ~32–34% share of marks on each — the single most important topic to have fully secure regardless of which paper is being revised for.
- Mensuration consistently returns the highest marks-per-question ratio on both papers (3.03 on Paper 2, 7.73 on Paper 4), making it especially valuable to answer fully once a question appears, even though it isn’t the most frequent topic.
- Numbers is proportionally far more prominent on Paper 2 than on Paper 4 — students sitting Paper 2 should not under-weight it relative to their Paper 4 revision balance.
- Statistics and Trigonometry both carry noticeably more relative weight on Paper 4 than on Paper 2, and are worth extra attention when preparing specifically for the extended-response paper.
- No topic is safe to skip entirely — every syllabus area has appeared on both papers across the shared data window, just with different relative emphasis.